
Power BI Data Modelling - BI Model for a Performance Marketing Company
- uzan baroto
- Aug 22, 2022
- 2 min read

Updated: Jan 20, 2023
Context:
This was a freelance project for a Digital Marketing company based in South Korea.
They had data coming from multiple sources, the ones I had to model here are:
Affiliate Tracking Software (Voluum)
This data contains campaign performance data such as clicks, revenue, impressions, and conversions. This data also contains campaign information for location, media buyer, and offer
Traffic Source Software (Kayzen)
This data contains the money spent on obtaining traffic for our clients, such as spend, clicks, and impressions. This data also contains campaign information for location, media buyer, and offer
Media Buyer Info
This data contains information on the media buyer and their initials
Task:
Create a Power BI model that integrates these three data into a single scalable, accurate, and robust report.
The first report should contain Revenue, Cost, Profit, ROI, and other performance metrics.
The data should be aggregated for each media buyer and each campaign.
Issues:
The spend and revenue data have to be aligned for each media buyer, but kayzen and voluum have different naming standards
The media buyer and campaign ID information is inside the campaign name and has to be extracted
Strategy:
Database normalization means that each table should serve a specific and distinct purpose.
This is why I built 3 tables:
2 lookup tables containing a primary key and the associated campaign information
1 data table containing the combined metrics and foreign keys
Then I separate the media buyer's initials and the campaign ID from the campaign name.
Use that information and the date to create a Primary Key for each data source (Kayzen & Voluum) since each campaign can only have one entry per day
Create the merged financial data table along with the appropriate Kayzen and Voluum keys.
Create a DAX-optimized media buyer initial column
Connect all the tables into a star schema

Reasoning:
Efficiency and Scalability are the reason for this schema instead of just merging data from both sources into a single table. Using a star schema allows Power BI to run more efficiently, and also allows for the addition of more tables in the future.
This is especially true for a digital marketing company that has to stay up to date on the latest tools and software. With this schema, if the company wants to add another traffic source, the entries have to be appended to the financial data table and the campaign information separated as a lookup table
Implementation:
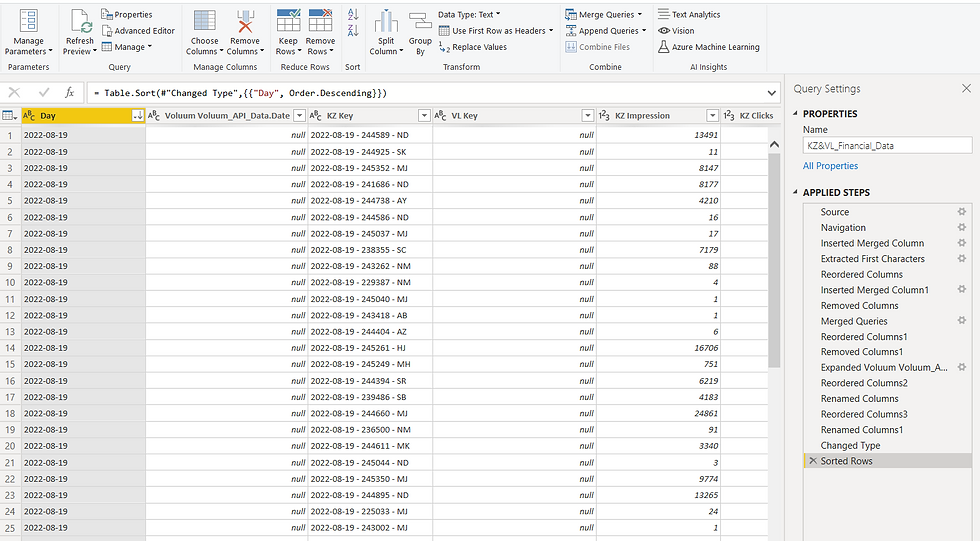
The first step is the creation of the Lookup Tables and the Data Tables. Power Query's "Applied Steps" will be applied every time the company refreshes the data, this is akin to the automation of a data cleaning and transformation.
The second step is creating DAX failovers on the key columns, this is required so the campaign identification doesn't break even if there is a miss-input of data.
These are the 3 columns that I created to solve the media buyer detection issue
Proxy = IF(ISBLANK(RELATED(VL_Identity_Lookup[VL Initials])) || CONTAINSSTRINGEXACT(RELATED(VL_Identity_Lookup[VL Initials]), "Keto"),RELATED(KZ_Identity_Lookup[KZ Initials]), RELATED(VL_Identity_Lookup[VL Initials]))MB Initials = IF(CONTAINSSTRING('KZ&VL_Financial_Data'[Proxy], "XM"), RELATED(VL_Identity_Lookup[VL Campaign ID]), 'KZ&VL_Financial_Data'[Proxy])MB = IF(ISBLANK(RELATED(MB_AM_Lookup[mediabuyer])), "UNKNOWN", (RELATED(MB_AM_Lookup[mediabuyer])))After designing the foreign keys, primary keys, and DAX Columns. I finally connected the tables into a single model.

This model is 99.998% accurate to the database table since 100 entries had to be removed because of duplication (out of 35.670 entries)
For the Visualization part of this project, please see the associated article

Comments